TL;DR
- A network diagram is a visual representation of an IT or VoIP network that shows devices, connections, and how systems communicate, helping engineers understand and manage the infrastructure.
- Accurate network diagrams are essential for VoIP and ISP environments because they speed up troubleshooting, support change management, and reduce errors caused by outdated or incomplete documentation.
- The two core types are physical diagrams (devices and cables) and logical diagrams (traffic flow and communication), including VLAN/subnet and application-layer diagrams. Physical diagrams help with ports and redundancy, while logical diagrams clarify VLANs, VRFs, and multi-IP designs.
- To create one, inventory all devices and connections, choose the appropriate diagram type, draw core components first, label clearly (IPs, VLANs, ports), and update the diagram regularly after changes
Why Accurate Network Diagrams Matter for VoIP and Network Design
As a consultant for telcos and ISPs who do VoIP, nearly all of my customers have network diagrams. We use these diagrams when we make network design changes or troubleshoot an existing network.
However, nearly any time we study a customer's network diagram in detail, they'll say, "Wait, that's not right. This doesn't even show the FL-2100 we installed two years ago!" Or, "No, there must be more cables than this. There's no way this is right."
While I still learn important things from every customer's diagram, having an accurate network diagram can help streamline project management and issue resolution. That's why learning to create network diagrams effectively can be very useful for anyone who builds and manages VoIP networks.
In this blog, I'll break down the different types of network designs and what you need to know to draw an effective network diagram.
What Is A Network Diagram?
A network diagram is a graphical representation that depicts the architecture of a network; but you knew that. But when done well, a diagram is a language, like English, or C# or Python. It very clearly and carefully describes a communications network. It's a visual language, yes, but just like English, it's not random in any way.
Network diagrams are important tools for engineering teams since they provide us with a way to understand the network that fits into our heads. The two most common categories network diagram types are physical diagrams, which shows the physical relationship between the components of a network, and logical, which shows how connecting devices in a network communicate with each other.
How can network diagrams help in troubleshooting
Network diagrams play a crucial role in identifying and resolving technical issues within telecom, ISP, and IT environments. Here’s how they help:
Visualizing Network Topology
A well-structured network diagram provides a clear view of how all devices and connections interact, making it easier to pinpoint where a failure might be occurring.
Identifying Single Points of Failure
In physical diagrams you can spot how a device has only one possible physical path into the network.
Speeding Up Issue Resolution
Engineers and IT teams can use diagrams to track dependencies, identify faulty devices, and reduce downtime by locating problem areas faster.
Assisting in Change Management
When making network upgrades or modifications, an up-to-date diagram helps ensure smooth transitions and avoids conflicts with existing configurations.
Supporting Compliance & Security Audits
Network diagrams document device locations, access points, and security protocols, helping businesses maintain compliance with regulations and cybersecurity best practices.
Regularly updating your network diagram ensures that it remains an accurate troubleshooting tool, helping IT teams prevent disruptions and quickly resolve network issues.

Logical: Shows how devices in a network communicate with each other.
The Role of Physical Network Diagrams in Network Infrastructure Design
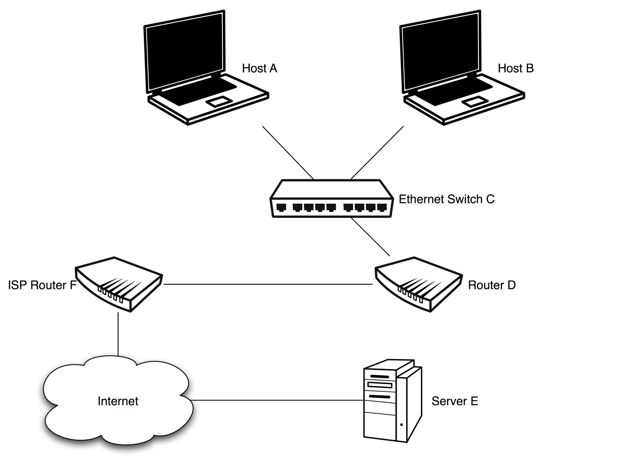
Nearly everyone who builds and manages VoIP networks maintains physical layer diagrams, where each box symbol on the network diagram represents a physical device component, and each line represents a cable.
Physical diagrams can help with troubleshooting wholesale outages, counting available ports, or designing fault tolerance. And they're fine for 1994-era IP networking – all hubs, no VLANs, and only one IP address per device.
The Limitations of Physical Network Diagrams
However, physical diagrams strain to convey:
VLAN Network Diagram Details
Which VLAN is this port assigned to? Is it a VLAN trunk?
Subnet Information
What subnet is this device a member of?
Network Roles and Functions
Which network components are doing routing? Switching? Basic servers?
IP routing tables per device
Such as Cisco VRFs / MPLS VPNs.
Multi-IP Devices in a Network Design
Visio users tend to insert pictures of the equipment, but it's often distracting and doesn't print well.
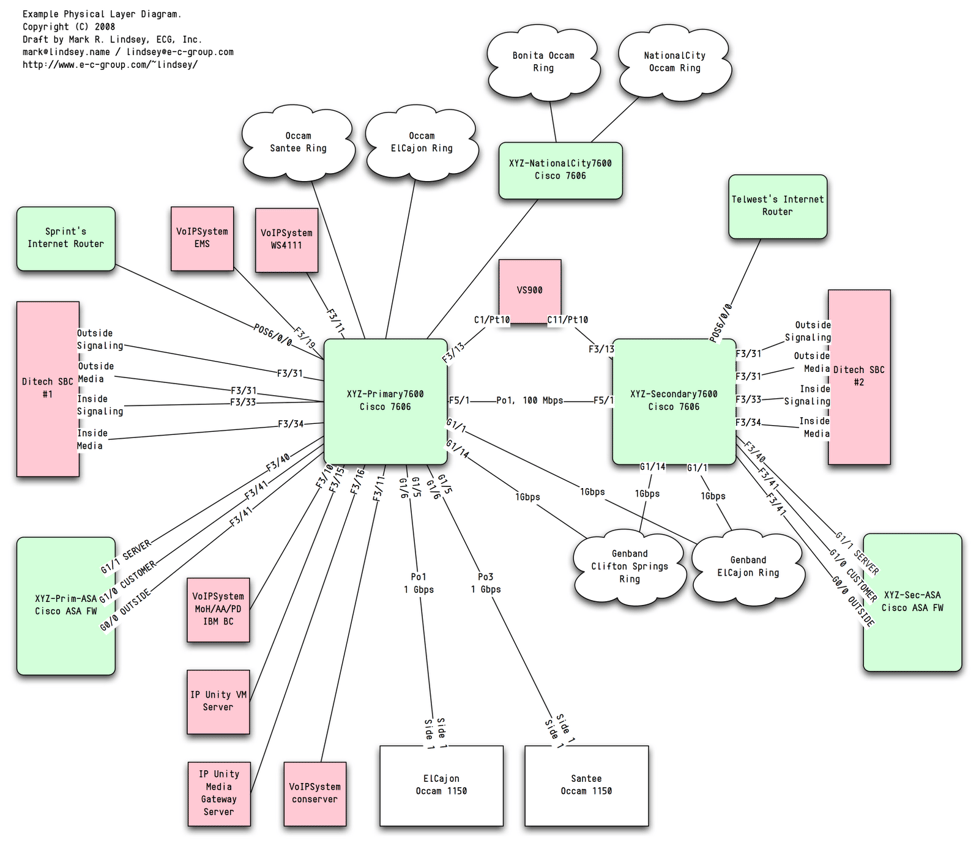
Physical Layer Network Diagram Example
Here's an example of a physical layer network diagram:
Types of Logical Network Diagrams
1. VLAN/Subnet Diagrams
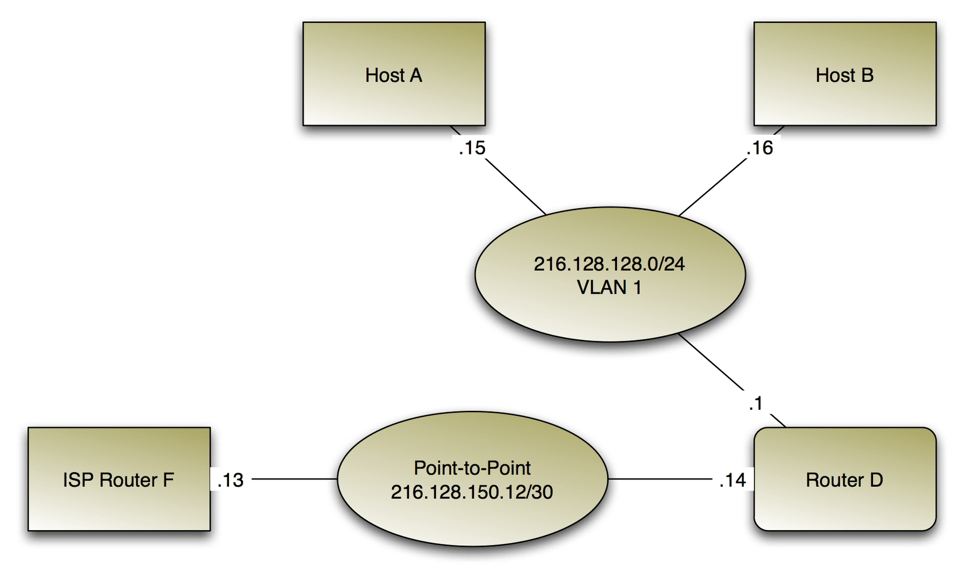
A VLAN/Subnet diagram is when each box represents a VRF or IP routing table – typically one per physical device. Every line represents an IP address assignment to a subnet. At the center, another shape, like an oval, represents the actual subnets or collision domains. In clean designs, one subnet is exactly one VLAN, and layer-2 switching equipment typically isn't drawn in.
VLAN/Subnet diagrams are ideal for following the paths of packets through the network. However, they have their limitations, too:
They can't represent layer-2 redundancy.They aren't good at identifying available ports.
Not every physical device is shown, so they aren't good for inventory.
They don't show what data flow is normal or expected.
When VRFs are involved, an alternate approach is to create a network diagram that represents VLANs with color-coded cables. A blue cable is VLAN 101, a red cable is VLAN 102, and a green cable is VLAN 103. This method can be effective as long as you only have a small number of VLANs; otherwise, you might end up asking, "Which VLAN is magenta...and which is purple?".
2. Application-Layer Communication Diagrams
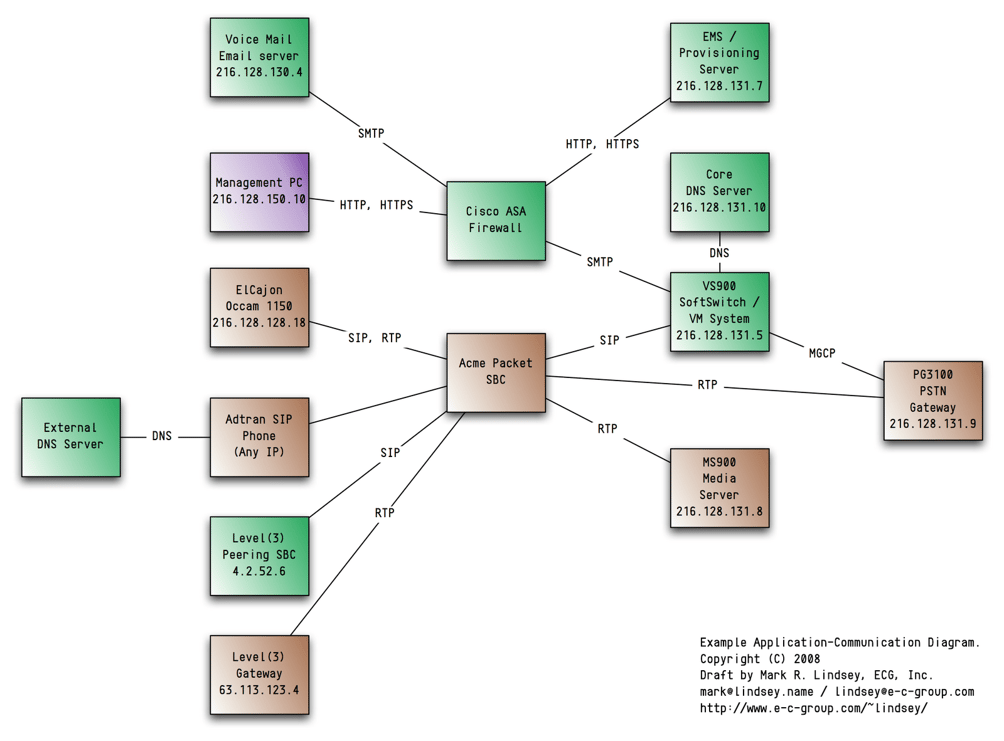
Another valuable abstraction for diagramming networks is called an application-layer communication diagram. This type of network diagram doesn't show any underlying transport but only the normal communication paths at the application layer. For any given device, there are connecting lines to every other device it communicates with at the application layer.
Application-layer communication diagrams are essential for developing effective firewall and IDS rules. They're also valuable for SIP VoIP platforms, where routing of SIP messages is complex and where it's reasonable to ask, "Where should this device be sending its INVITE? To what other devices will it be sending RTP?".
An example of an application-layer communication network diagram is below:

Step-by-Step Guide to Drawing a Network Diagram
Drawing a network diagram requires detailed knowledge of the network's architecture and every device involved. Here's a step-by-step guide to help you draw a basic network diagram:
Identify and list each device in your network: This can include servers, routers, switches, hubs, and endpoints like workstations and laptops.Decide on which topology to use for your network: The topology could be bus, star, tree, ring, or mesh, as discussed above. The topology you choose will shape how your devices are interconnected.
Draw the main components first: Start by plotting the central devices like switches, servers, or routers that act as your network's principal hubs or backbones.
Connect the devices: Once the main components are in place, draw lines representing the connections between each device.
Add endpoints: Now, you can add endpoints like workstations and laptops and connect them to the main device.
Label all devices and connection points: Clearly label each device, connection, and relevant symbols. This can include information like device names, IP addresses, and the type of connection.
Review and update: Ensure that all network devices are included and accurately interconnected. Regular updates of the diagram are necessary to reflect changes within the network.
Remember that the goal of creating a network diagram is to visually represent your network's structure. Diagramming software can also assist in simplifying the design and updating processes of complex diagrams.
Common Mistakes to Avoid When Drawing a Network Diagram
Creating a network diagram requires precision and clarity. Avoiding these common mistakes ensures your diagram is both useful and scalable:
1. Overcomplicating the Diagram
A cluttered network diagram can be hard to read and interpret.Often physical networks cannot be diagramed in a readable way. You can just have too many cables to show on the diagram. In these cases use a table.
Mixing network layers makes the diagram too complex: engineers often mix physical diagrams (showing cables) with IP network diagrams (showing Layer 3 addressing), but in the advent of VLANs and VRFs this only makes for an unclear diagram.
2. Not Using Standard Symbols
Decide on a way that your diagram will correspond to configurations, and stick with it.For example, on an ECG subnet diagram, rectangles represent devices (that have a routing table), and lines are only for IP address assignments. You would never mix-and-match to make one line mean an IP address assignment, while another represents an Ethernet cable.
3. Lack of Proper Labeling
Each element (routers, switches, servers, firewalls) should be labeled with meaningful names.In a physical diagram, you want to label the physical devices and cable identifiers in your network.
In a logical diagram (showing IP addresses, devices with IP addresses, subnets) you want to show those IP addresses, hostnames, and VLAN IDs.
4. Forgetting to Update the Diagram
Networks evolve with new devices, configurations, and security policies.An outdated diagram can lead to incorrect troubleshooting and planning.
If you make the diagram more visible - such as on a poster, or you always use it in network planning or troubleshooting, you'll be more likely to notice when it needs updating.
Many small network operators tend to try to keep their network in their mind.
5. Ignoring the Need for Growth
Networks grow and evolve, and diagrams have to adjust along with them.It's rare that one network will describe a significant service provider or enterprise network. Typically multiple networks, showing different layers or network regions, need to be maintained.
By following these best practices, network diagrams remain an effective tool for planning, troubleshooting, and optimizing infrastructure.
How often should you update your network diagram?
Regular updates ensure that your network diagram reflects the actual state of your infrastructure, preventing inefficiencies and errors. Here’s how often you should update it:
1. After Any Major Network Change
Update your diagram when new devices (routers, switches, firewalls) are added or removed.
Reflect changes in configurations, subnet structures, and traffic flow.
Ensure that new security policies or firewall rules are included in the diagram.
2. During Security Audits
Security audits require an up-to-date network map to identify vulnerabilities.
Ensure compliance with industry regulations such as HIPAA, GDPR, or PCI-DSS.
Verify access controls, VPN configurations, and firewall placements.
3. At Least Quarterly for Growing Networks
Expanding businesses should review diagrams every 3 months to match network growth.
Any remote office expansions or cloud integrations should be documented.
Keeping diagrams updated ensures IT teams are aligned on current infrastructure.
4. Before Troubleshooting Sessions
A current network diagram speeds up diagnosis of connectivity issues.
Helps in quickly pinpointing misconfigurations, broken links, or bottlenecks.
Ensures that network engineers don’t waste time analyzing outdated setups.
5. Annually for Stable Networks
Even if no major changes occur, an annual review ensures diagrams remain accurate.
Check for deprecated technologies, outdated device models, or planned upgrades.
Verify backup and disaster recovery paths are still functional.
Updating your network diagram regularly improves network visibility, security, and operational efficiency. A well-maintained diagram is a valuable tool for IT teams, network engineers, and decision-makers.
Learn How To Draw a Network Diagram With Expert Guidance From ECG
If you're struggling to draw network diagrams, we're here to help. Drawing an effective network diagram takes a lot of in-depth experience in designing and managing different network architectures.
Working with a voice engineering consultant like ECG can help you get the expertise needed to create a network diagram that represents your complex systems. We have years of proven experience building and supporting voice networks for dozens of VoIP service providers in the U.S. and worldwide, so you can trust our engineering team to deliver elegant network designs or provide the training your staff needs to draw a network diagram better.
Ready to create more accurate diagrams for your network upgrade and expansion projects? Get in touch with ECG today.
Network Diagram FAQs
What is a network diagram?
A network diagram is a visual map of an IT network that shows key devices (like routers, switches, servers, firewalls, and endpoints) and how they connect. It helps engineers understand traffic flow, troubleshoot issues, and plan network changes with confidence. Network diagrams can be physical -- showing the cables and physical devices. Or, network diagrams can depict VLANs and subnets, showing IP address assignments. Or, network diagrams can be at the application layer, showing the network functions, and application-layer protocol connections between those.
How to make a network diagram?
List every device and connection first, then choose the right diagram type for your goal (Physical, Subnet, or Application Layer). Draw the core network elements, connect them, label everything (device names, ports, IPs/VLANs as needed), and keep it updated after changes. For Physical Diagrams, you're drawing a line for each actual cable, and usually an icon or rectangle for each physical device. For Subnet diagrams, ECG uses an oval for the subnet/VLAN, and indicates the VLAN ID and IP address range in that oval. Then each line represents an IP address assignment - not a cable. Routers are going to be connected to multiple subnets, and we use a special symbol to distinguish routers from simple servers that have multiple IP address assignments. For application layer diagrams, you depict each of the software components that processes traffic, and then draw a line indicating data flowing to other components.
What are the three types of network diagrams?
Physical diagrams show devices and cables. VLAN/Subnet diagrams show how IP addresses are assigned. And Application-layer diagrams show the flows and links of protocols.
Can ChatGPT create network diagrams?
Yes. ChatGPT can help you outline the diagram, choose the right format (physical vs. logical), and produce a clean layout you can recreate in your preferred tool. If you’re still struggling or your network is complex, it’s worth getting in touch with a professional. Professionals find the accuracy on the diagrams to be too low to be useful to use for real purposes.